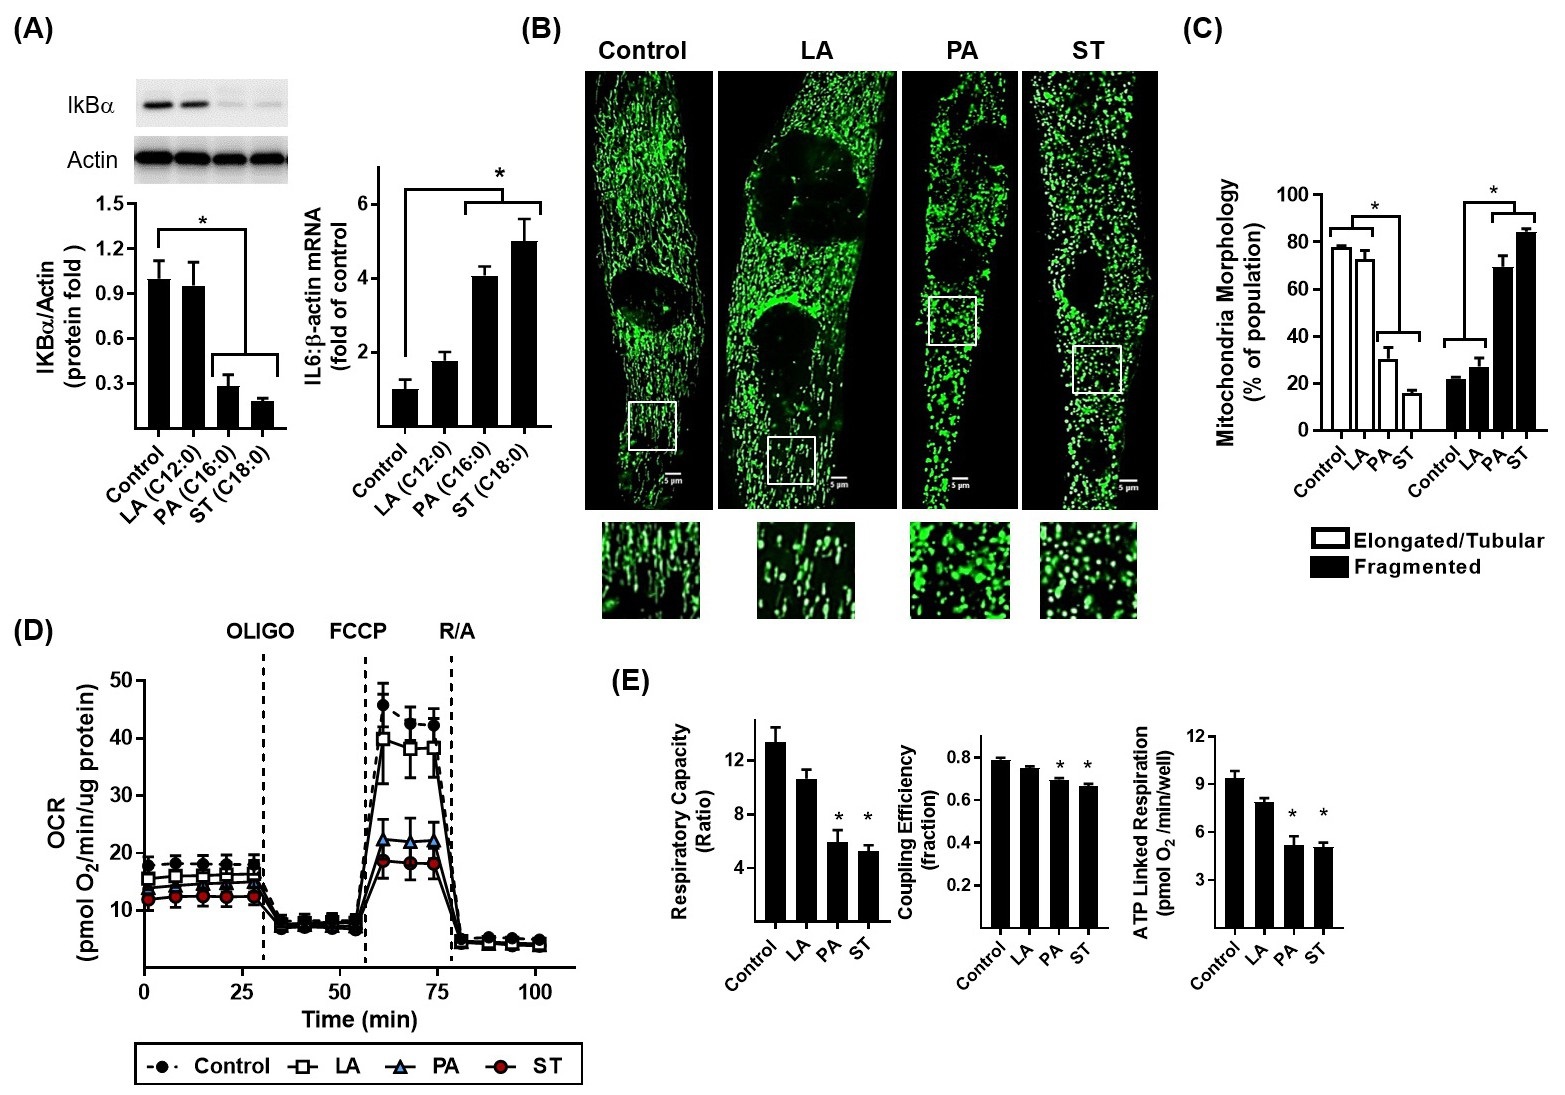
Fig. 1. Effects of fatty acyl chain saturation on NFkB signalling, mitochondrial morphology and cellular respiration in L6 myotubes. L6 myotubes were incubated in media containing D-glucose (5 mM) in the absence and presence of saturated fatty acids laurate (LA, C12:0), palmitate (PA, C16:0) or stearate (ST, C18:0) for 16 h prior to analysis of: (A) cellular IkBα abundance by immunoblotting and IL6 and β-actin mRNA abundance by qPCR; (B) analysis and quantification of mitochondrial morphology assessed by mitotracker green (mitospy) staining and confocal microscopy. The white boxed areas are magnified to show differences in morphology, the scale bar in the main visual fields represents 5 μm. (C) Mitochondrial morphology (elongated versus fragmented) was subsequently quantified using ImageJ software. For analysis of real-time cellular respiration in L6 myotubes we used a Seahorse XF24 analyser. L6 myotubes were incubated for 16 h with either GLC (5 mM) alone (control) or glucose co-supplemented with 0.4 mM of either LA, PA or ST. Oligomycin (1 μM), FCCP (1 μM) and a rotenone (1 μM)/antimycin-A (2 μM) mix were added at times indicated by the dotted lines on the Seahorse trace. The trace shown in (D) is a representative readout of oxygen consumption rate (OCR) from a single experiment with time point (mean ± SD) representing a triplicate measurement. The data shown in (E) indicates the respiratory capacity ratio, coupling efficiency of oxidative phosphorylation and ATP linked respiration respectively (5 determinations/condition/experiment). The graphical data shown in (A, C and E) are the combined analyses of three separate experiments and represent mean ± SEM. Asterisks indicate a significant change (P<0.05) to the control condition or between the indicated bars.